Business Process Analysis
As a result of simulation collects a lot of data about the business process such as function states, statuses of resources and tasks. These data allow to analyze the efficiency of the process. For convenience of analysis to user already provided consolidated data, displayed in one place - on the Dashboard. The dashboard located in View section of the Control panel. Data on the dashboard are available as during the simulation and at its end.
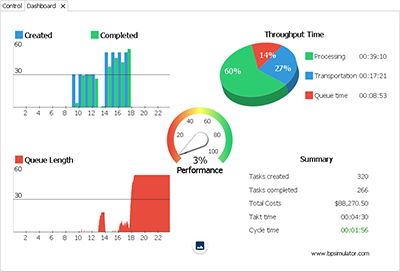
Chart of created / completed tasks
The chart is designed to analyze the timing receipts of new tasks and their completion as a business process execution result.
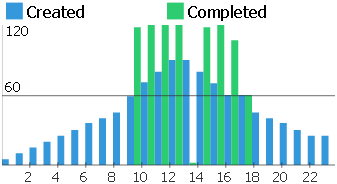
Using this of char can be identify the time periods when the tasks arrives more than capable of handling.
Throughput Time
The diagram "Throughput Time" shows the distribution of total operating time on a task from its creation to completion.
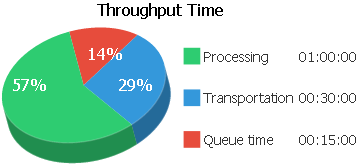
- Processing - average amount of a functions executions duration
- Transportation - average amount of the transfer time from function to function
- Queue time - average amount of time spent to the waiting of task processing
This diagram shows the possibility for improvements when necessary to reduce the runtime of a business process.
Performance
Indicator "Performance" reflects the overall performance at time of the business process.

At 100% the value of the indicator are no problems with the overall performance of the business process.
Chart of queue length
On the graph shows the distribution of the sums the number of tasks in the queue for days.
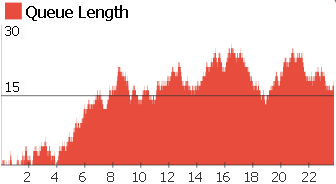
Availability and growth of the queue length means that there is performance bottlenecks of a business process in these periods.
Summary
The summary results of of simulation of a business process:
- Tasks created - amount of the generated tasks;
- Tasks completed - amount of tasks which have reached to the end of the business process;
- Total Costs - amount of costs of executors and resources during the execution of the business process;
- Takt time - calculation period between the generation of new tasks of a business process, analog of indicator of the Lean methodology;
- Cycle time - average period between tasks which have reached the end of of a business process, аanalog of indicator of the Lean methodology.
To export all elements at the Dashboard to graphics format push the "Save as Image" button.